All physical processes have variability. In the past hundred years scientists and mathematicians have devised many methods for “seeing through” variability to the underlying principles. “Statistics” is the art devised to help deal with variability.
It is usual in introductory statistics to focus on models for variability and it is usual for students to learn about “average”, and “standard deviation” and bell curves. It is less usual for students to have real laboratory data to deal with. Real data rapidly teaches that bell curves are few and far between. People who have never spent time in a laboratory taking data can be forgiven for believing that most distributions are Gaussian since this is usually all they know.
The use of “average” and “standard deviation” presumes certain kinds of distributions, usually Gaussian, also known as the Normal distribution. (The word “Normal” here does not mean “usual”, it means “independent”.) So while it can be useful to know what the distribution of a sample is, it is often not necessary. Much of the time all you want to know is whether two samples are different, and/or if one sample (the outputs of some process) is larger or smaller than some other sample.
To deal with variability in the real world one must start with non-parametric statistics, that is, statistics that do not presume any particular distribution. It is never appropriate to assume that a new distribution is Gaussian without testing.
A powerful and simple nonparametric method for comparing distributions or for comparing distributions to functions is the class of Kolmogorov-Smirnov (K-S) statistics. K-S tests are a sort of statistical multi-tool. The Lillefors test for normality uses the K-S method to compare a sample to the cumulative curve represented by the average and standard deviation of the data
The basic idea is easy. Construct the empirical and/or theoretical cumulative distributions, and then look at the maximum difference between the distributions projected onto the cumulative axis. This difference is the statistic for the test. All K-S statistics are based on this maximum distance between cumulative curves along the cumulative axis.
The use of cumulatives avoids the need to “bucket” or group the data. This puts the representation of continuous and disconcontinuous functions on a parallel basis. For the X axis, or non cumulative axis, you can transform the data to suit your purposes. It does not change the statistical test.
Even for cases where parametric statistics are appropriate, the K-S statistic still works, though sometimes with less “statistical power” than a focussed parametric test. But there are few tests with the general power and utility of the K-S type statistics. If you learn nothing else about statistics, I urge learning how to use the various K-S tests.
In statistics, a “sample” means a set of numbers, and for the K-S tests the numbers must be continuously distributed, that is, real numbers. Duplicates should be unlikely. Duplicates may invalidate the K-S tests.
There may be some issues with regard to nomenclature. My 1970 book by W. J.Conover, “Practical Nonparametric Statistics” calls the two random sample test the Smirnov Test, and the comparison between one random sample and a function with no degrees of freedom the Kolmogorov Test. Calling the two sample test a K-S test creates no logical problem except for figuring out what significance table or function to use.
First let’s look at a comparison of a function with a sample using the Microsoft Excel random number generator. We expect that the cumulative distribution for the uniform number generator to be a straight line between zero and one.
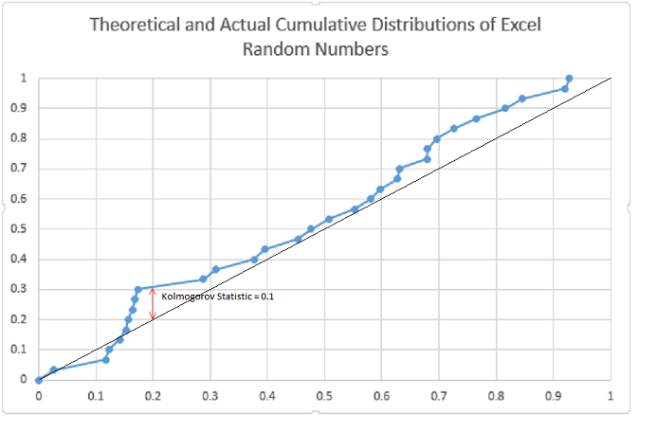
For this test, the (one sample) Kolmogorov statistic is 0.1. As a crude approximation 1/sqrt(N)= 0.18 is the 80% significance level, so as far as this test goes, we can presume the generator to be “uniform”, that is, the sample is not significantly different from the expected continuous distribution.
Let’s look at an example of a classic problem: Fisher’s analysis of Darwin’s data on “fertilisation”
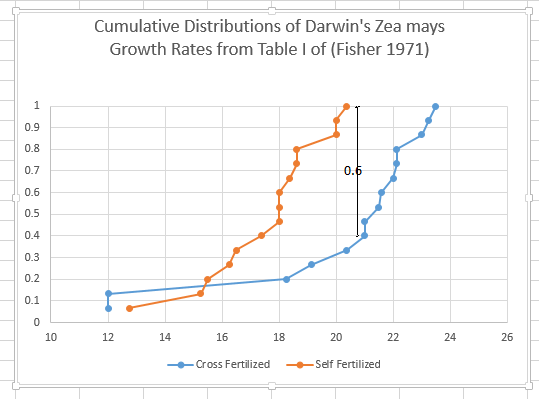
I cite the example not to disparage the great geneticist Sir Ronald Fisher, who was brilliant for his day, but to show how much progress has been made in dealing with variability. In his classic book, “The Design of Experiments”** , Fisher discusses some data of Darwin on the breeding of plants. Darwin was trying to show that cross fertilisation (I assume we would say pollination) was better than self fertilisation. Fisher shows some data, and says (pp 38) “that for these data, t > 2.148, or significant at the 5% level, that is barely significant”. Darwin wanted the difference to be significant, the more the better. Given the great variability, Darwin had been uncertain of the outcome. Subjecting the same data to the Smirnov two sample one sided test, it is clear that the distributions differ by 9/15. Thus it is less than 0.5% probability that the two data sets are from the same distribution. The cross fertilized were quite significantly bigger. This conclusion was far less clear in the early 20th century.
Summary of K-S Related Tests
( A “sample” means a group of numbers originating from some process.)
(The term “one sided” means we want to know only if either the function or sample is significantly greater or lesser, but not both.)
(A “parameter” is a number used to define a distribution. Average, standard deviation, skewness, kurtosis are all parameters.)
To test a function with no parameters estimated from the data against a sample, use the Kolmogorov Test, also called the Kolmogorov-Smirnov one sample test. The function can have its own parameters, but these must be independent of the data being tested.
To test two samples against each other use the Smirnov Test, also called the Kolmogorov-Smirnov two sample test.
To test a function with one parameter estimated from the sample, use the Lillefors exponential function test.
To test a function with two parameters estimated from the data such as average and standard deviation use the Lillefors test for normality
